
Nevada recorded 374 traffic fatalities in 2023, a rate of 1.23 deaths per 100 million vehicle miles ravelled, which exceeds the national average of 1.11. The state’s combination of long rural stretches, high tourist traffic in Las Vegas, and elevated speed limits creates a distinctive collision risk profile.
The Nevada Department of Transportation’s 2023 crash analysis found that Clark County accounted for 58 percent of the state’s traffic fatalities despite representing 73 percent of the total population. The Las Vegas Strip and surrounding arterials are particularly high-density collision zones due to pedestrian volume and driver unfamiliarity.
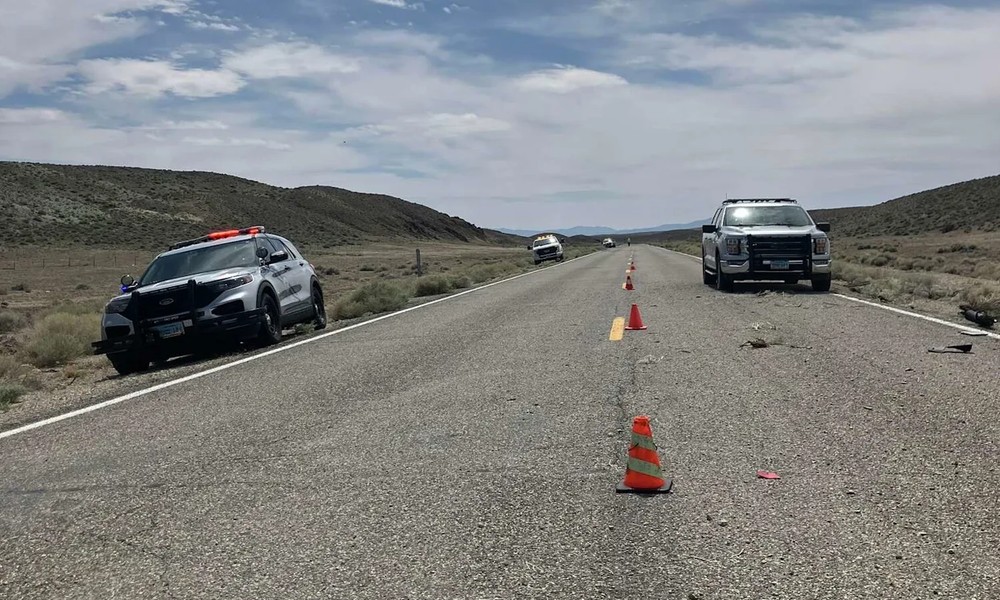
How Rural Nevada’s Road Characteristics Contribute to Fatal Crashes
Rural Nevada highways including US-93, US-50, and Nevada Route 376 combine 70 to 80 mile-per-hour speed limits with minimal emergency medical service access. Rural crash fatality rates are significantly elevated by extended EMS response times, averaging 18 to 24 minutes in remote sections versus 5 to 8 minutes in Clark County.
Single-vehicle collisions, typically involving rollover events or roadway departure in adverse conditions, account for 41 percent of rural Nevada traffic deaths. Road departure prevention measures including cable median barriers have reduced this category in states where they have been applied systematically.
What Tourist Driver Behavior Contributes to Las Vegas Collision Data
Rental vehicle involvement is a factor in a disproportionate share of collisions on Las Vegas surface streets, reflecting unfamiliarity with local traffic patterns and navigation distraction. Tracking these incident patterns through a dedicated Nevada car collision news source provides the ongoing situational awareness that local residents, insurance professionals, and legal practitioners need to understand how collision risk is distributed across the metropolitan area.
How DUI Enforcement Affects Nevada’s Crash Statistics
Nevada employs saturation patrol programs and sobriety checkpoints at a higher frequency than the national average per capita. Clark County’s DUI arrest rate in 2023 was 3.4 per 1,000 licensed drivers, compared to a national average of 2.1 per 1,000. Despite high enforcement intensity, alcohol involvement remains a factor in 32 percent of Nevada traffic fatalities.
Infrastructure Projects Targeting Nevada’s High-Risk Intersections
Nevada DOT identified 47 high-injury network intersections for targeted safety improvement funding in fiscal year 2024. Priority interventions include protected turn phase installation, leading pedestrian intervals at high-crossings, and roundabout conversions at stop-controlled intersections with high t-bone collision frequency.
Nevada’s collision landscape is shaped by the intersection of tourist behavior, rural infrastructure limitations, and concentrated urban traffic volume. Understanding these patterns at a corridor and intersection level is essential for residents, attorneys, insurers, and safety planners operating in the region.